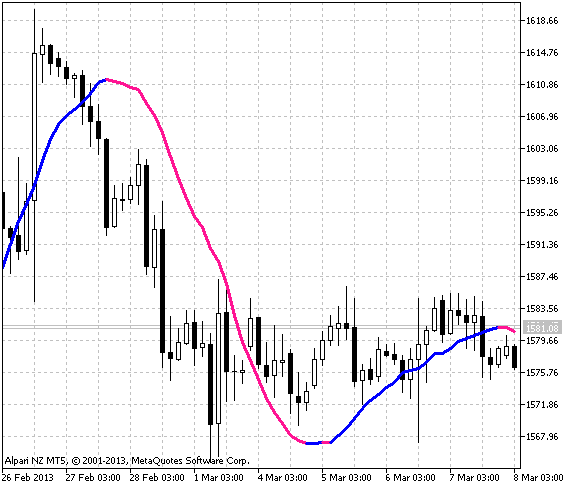
1. Moving Averages (MA)
Moving averages smooth out price data to identify trends:
- Simple Moving Average (SMA): Average of closing prices over a set period. Helps spot trend direction.
- Exponential Moving Average (EMA): Gives more weight to recent prices; reacts faster to price changes.
Example use: Buy when short-term EMA crosses above long-term EMA (golden cross); sell on the opposite (death cross).
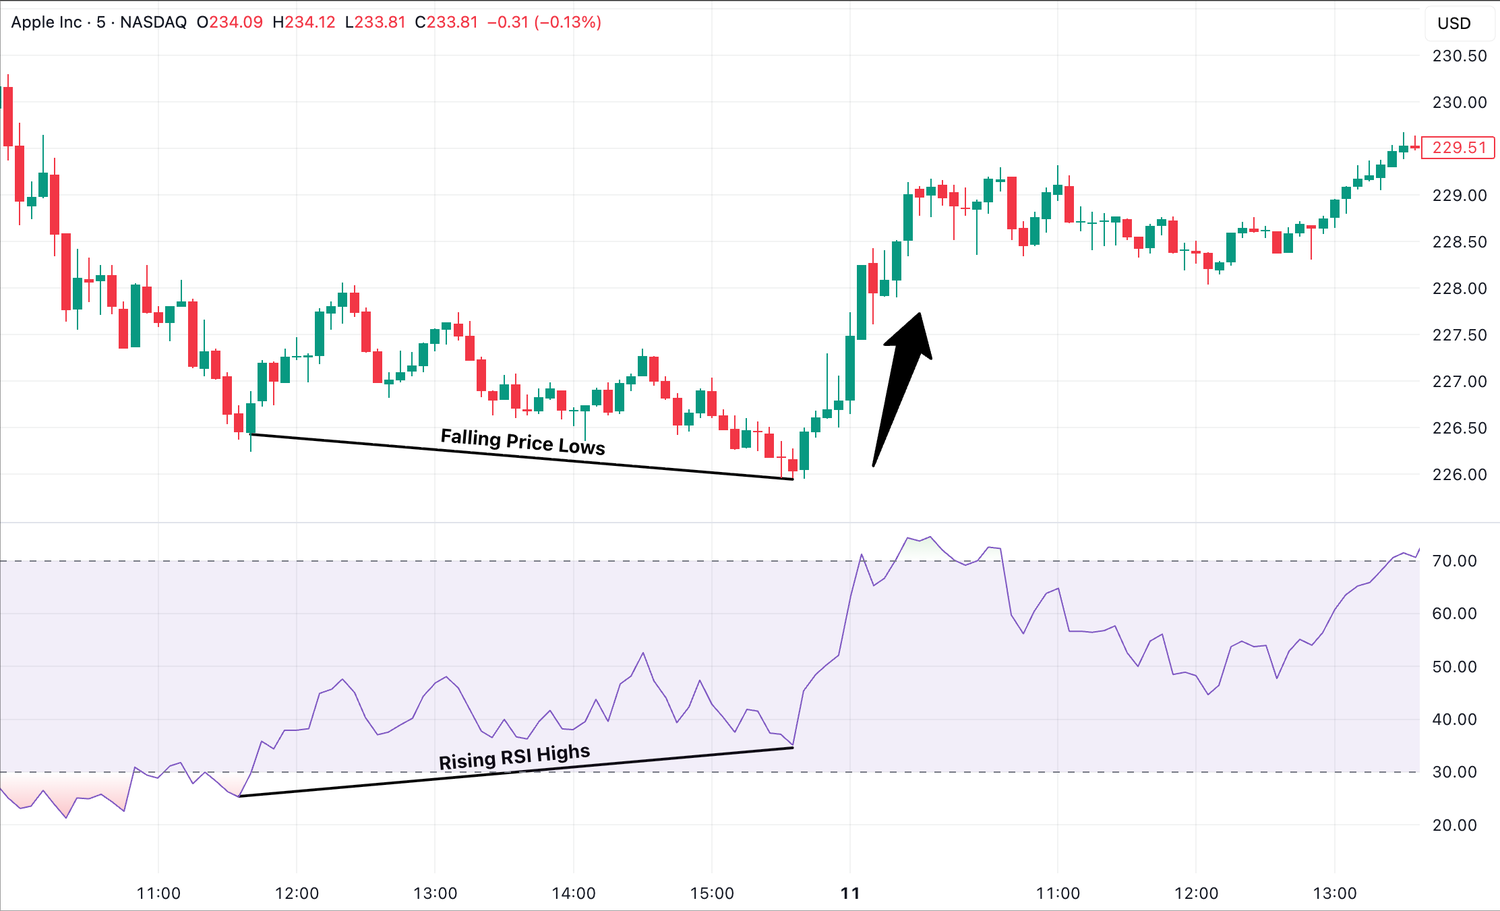
2. Relative Strength Index (RSI)
RSI measures momentum and identifies overbought or oversold conditions:
- Scale: 0–100. Above 70 = overbought (potential sell), below 30 = oversold (potential buy).
- Use RSI divergence to spot trend reversals.
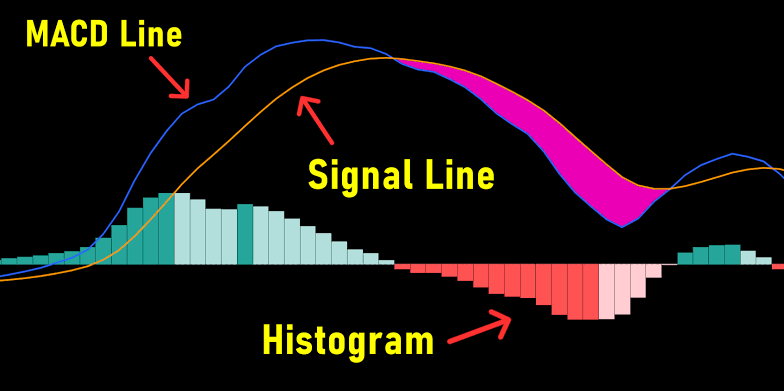
3. MACD (Moving Average Convergence Divergence)
MACD helps detect trend changes and momentum:
- Components: MACD line, signal line, histogram.
- Buy signal: MACD line crosses above signal line; sell signal: crosses below.
- Histogram shows the strength of the move.
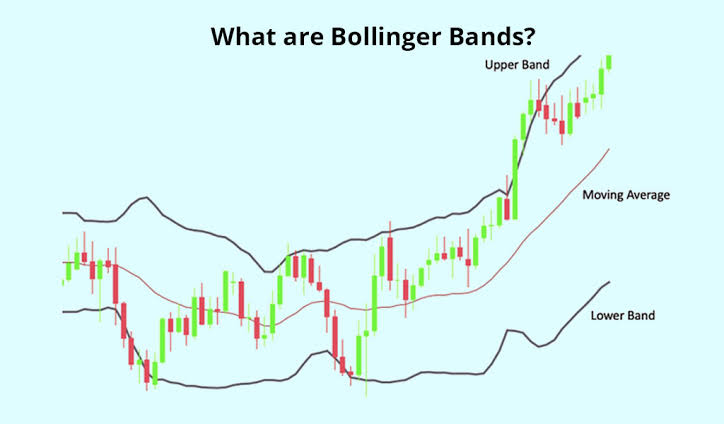
4. Bollinger Bands
Bollinger Bands indicate volatility and potential price breakouts:
- Consists of SMA middle line + upper and lower bands (standard deviations).
- Price touching upper band: overbought; lower band: oversold.
- Band squeezes signal potential breakout.
Key Takeaways
- Combine indicators for stronger trade signals.
- Use RSI for momentum, MA for trend, MACD for confirmation, Bollinger for volatility.
- Practice on charts to develop pattern recognition and timing.