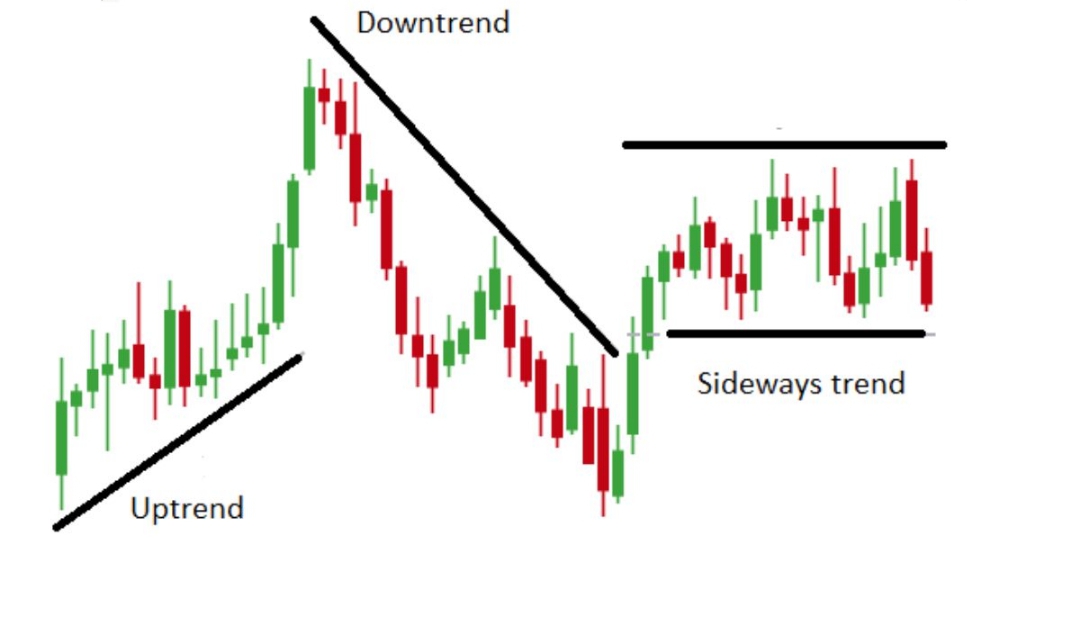
1. Trend Types
Recognizing trends is crucial for timing trades. Key types:
- Uptrend: Higher highs and higher lows, indicating buying pressure.
- Downtrend: Lower highs and lower lows, indicating selling pressure.
- Sideways/Range: Price moves horizontally; consolidation before next move.
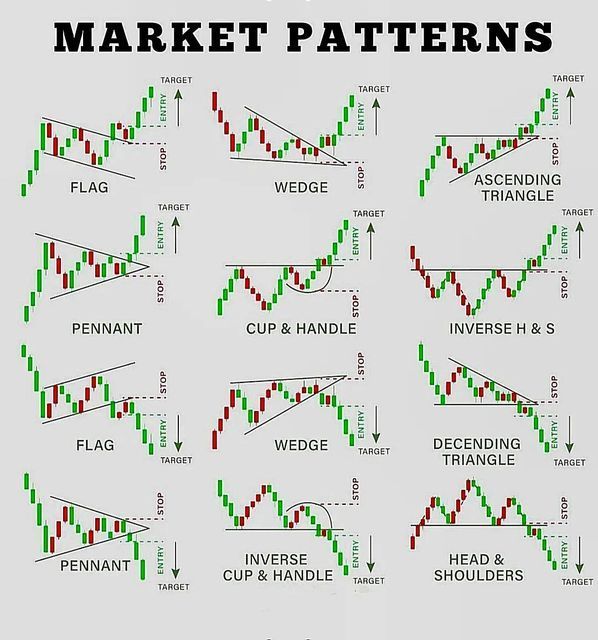
2. Common Chart Patterns
Patterns help predict potential price movements:
- Head and Shoulders: Signals trend reversal; can indicate top or bottom formation.
- Double Top/Bottom: Double peak or trough; shows potential reversal zones.
- Triangles (Symmetrical, Ascending, Descending): Indicates continuation or breakout.
- Flags and Pennants: Short-term continuation patterns after strong moves.
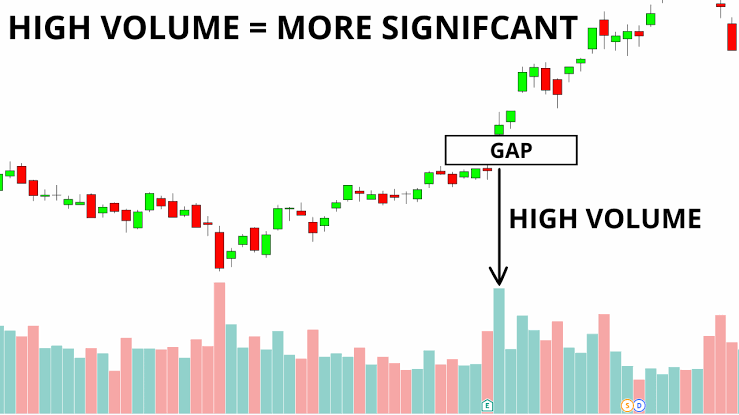
3. Volume Analysis
Volume confirms trends and breakout strength:
- Increasing volume during an uptrend supports bullish momentum.
- Decreasing volume during consolidation may indicate weak trend continuation.
- Volume spikes on breakout can validate the move.
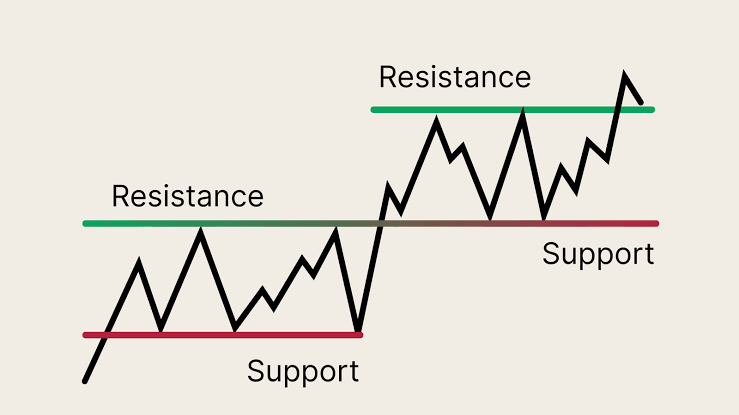
4. Trendlines & Support/Resistance
Draw trendlines to define trend direction and potential reversal points:
- Connect swing highs/lows to plot trendlines.
- Support: Price level where buyers step in.
- Resistance: Price level where sellers step in.
- Breakouts above resistance or below support often indicate strong moves.
Key Takeaways
- Combine chart patterns, trendlines, and volume for stronger trade signals.
- Recognize trend type before entering trades to align with market direction.
- Practice pattern recognition on historical charts for faster decision-making.