1. What is a Candlestick?
A candlestick is a visual representation of price action over a specific period. Each candlestick shows the opening, closing, high, and low prices.
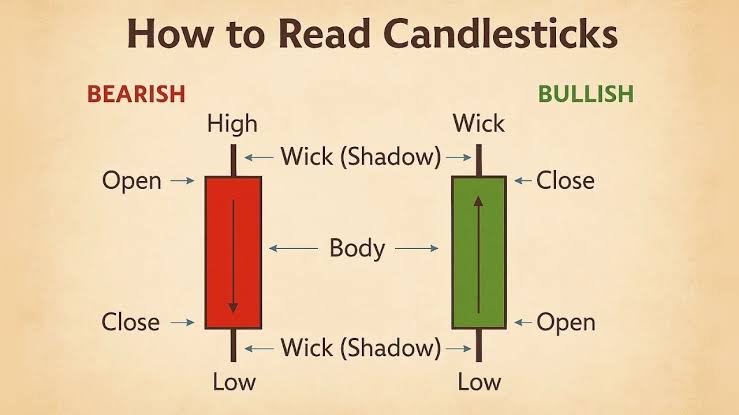
2. Candlestick Components
- Body: The filled area showing the opening and closing prices.
- Wicks/Shadows: Lines extending from the body representing high and low prices.
- Color: Typically green/white for upward movement, red/black for downward.
3. Bullish vs Bearish Candles
Bullish candles show price rising (close > open), while bearish candles show price falling (close < open).
4. Basic Patterns
- Doji: Open and close are almost equal; signals indecision.
- Hammer: Small body at the top, long lower wick; often shows potential reversal.
- Shooting Star: Small body at the bottom, long upper wick; may indicate trend reversal.
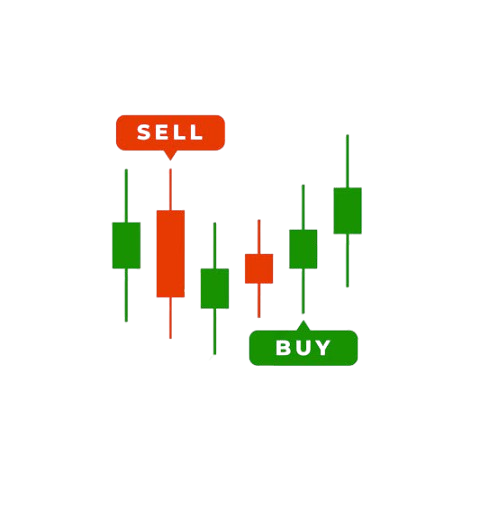
5. How to Use Candlesticks
Candlesticks help you spot trends, reversals, and market sentiment. Combine patterns with volume and other indicators for stronger analysis.
Key Takeaways
- Candlesticks show price action clearly in one visual.
- Color and shape indicate market sentiment.
- Patterns help anticipate possible reversals or continuation.