1. Types of Charts
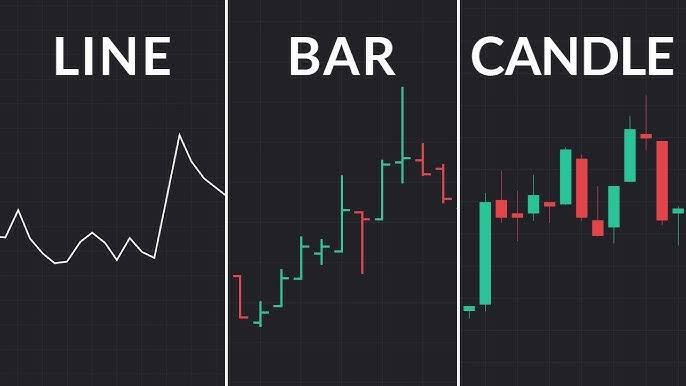
Three main chart types are used in crypto trading:
- Line Chart: Connects closing prices; simple trend visualization.
- Bar Chart: Shows open, high, low, and close (OHLC) for each period.
- Candlestick Chart: Most popular; combines visual clarity with OHLC data.
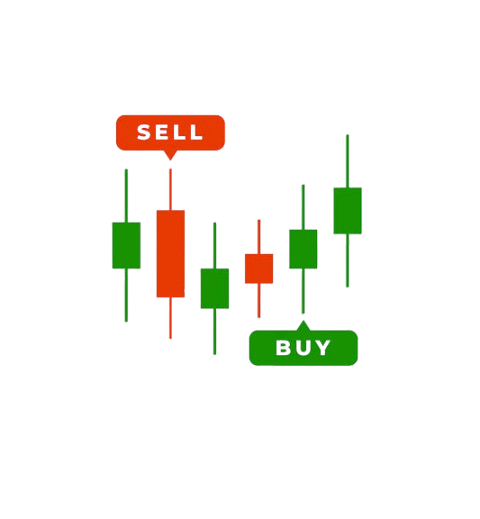
2. Reading Candlestick Charts
Building on Lesson 6, charts allow you to spot bullish and bearish trends. Look for patterns like Doji, Hammer, and Shooting Star.
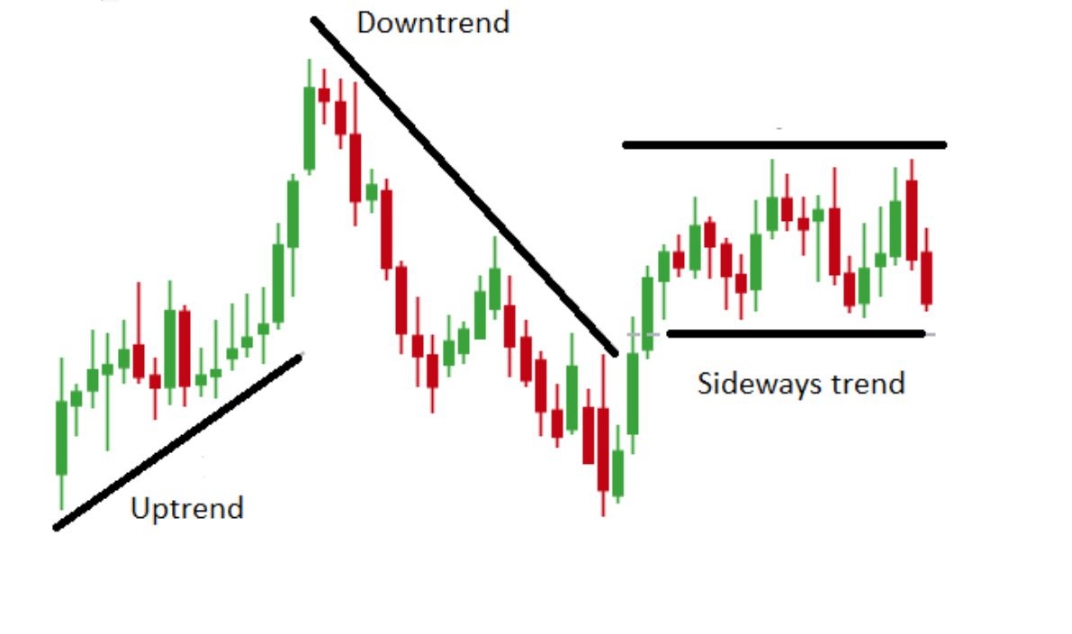
3. Trend Identification
Trends show market direction. Key points:
- Uptrend: Series of higher highs and higher lows.
- Downtrend: Series of lower highs and lower lows.
- Sideways: Price moves within a range; no clear direction.
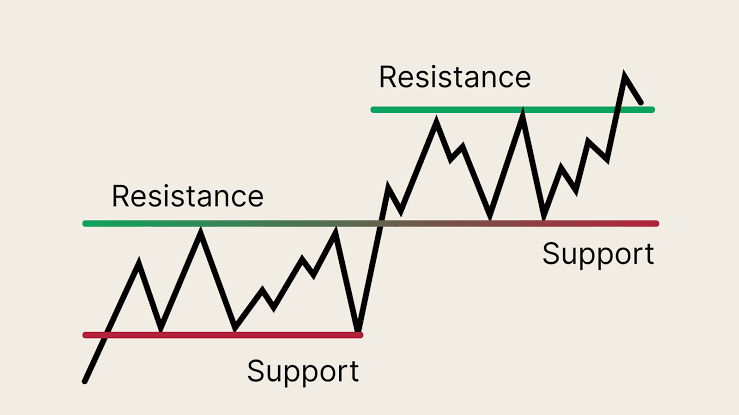
4. Support and Resistance
Identify levels where price tends to stop or reverse:
- Support: Price floor where demand is strong.
- Resistance: Price ceiling where selling pressure increases.
Key Takeaways
- Charts help visualize price action clearly.
- Recognize trends and patterns for smarter trading decisions.
- Combine candlestick analysis with support/resistance for entry/exit planning.