1. What Are Technical Indicators?
Technical indicators are calculations based on price, volume, or open interest. Traders use them to forecast future price movements and confirm trends.
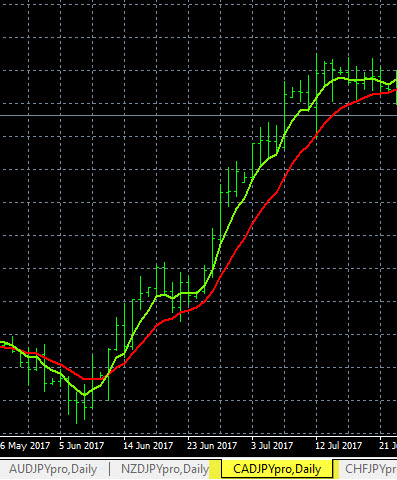
2. Trend Indicators
- Moving Averages (MA): Smooth out price data to identify trend direction. Common types: Simple MA, Exponential MA.
- Moving Average Convergence Divergence (MACD): Shows relationship between two MAs; used for trend and momentum.
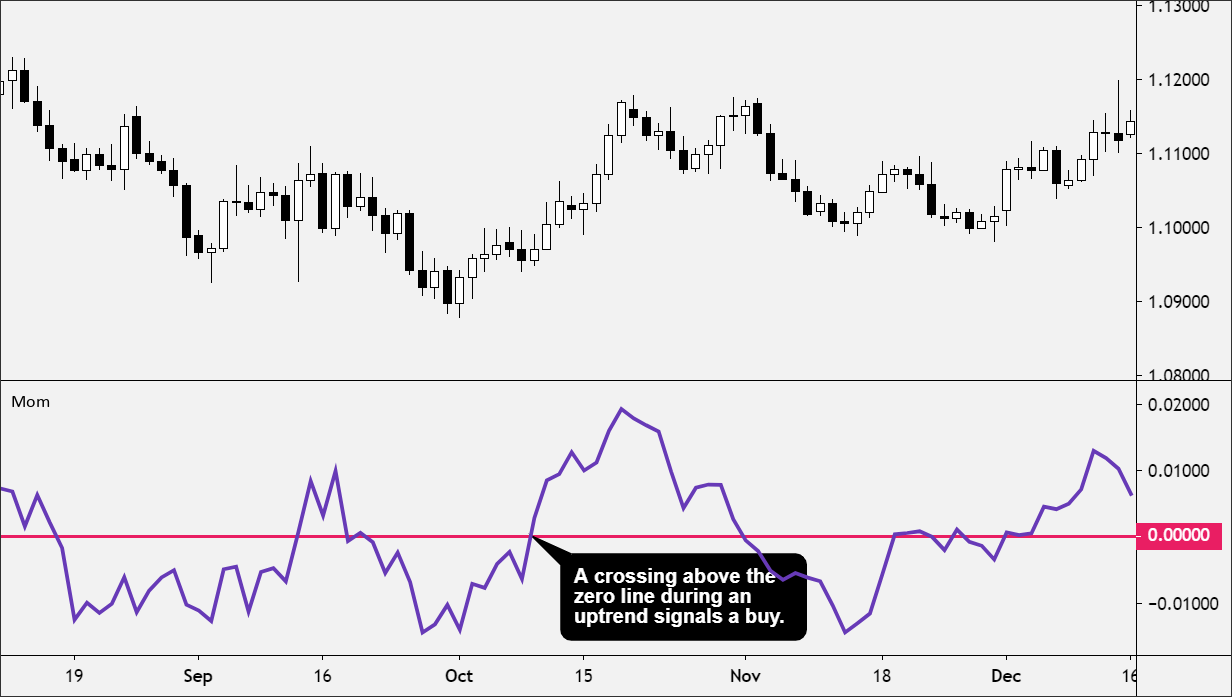
3. Momentum Indicators
- Relative Strength Index (RSI): Measures speed and change of price movements; helps identify overbought or oversold conditions.
- Stochastic Oscillator: Compares a closing price to a price range over a period; predicts potential reversal points.
4. Volume Indicators
- On-Balance Volume (OBV): Measures buying and selling pressure by combining price and volume.
- Volume Moving Average: Helps detect unusual trading activity that can signal a breakout or reversal.
5. Combining Indicators
No single indicator is perfect. Combining trend, momentum, and volume indicators can give higher probability trade signals. For example:
- Use RSI to check overbought/oversold levels before following a MACD trend signal.
- Confirm price breakout with volume increase.
Key Takeaways
- Technical indicators guide better entry and exit timing.
- Trend indicators show market direction; momentum indicators reveal speed of price movement; volume indicators validate moves.
- Combine multiple indicators for stronger signals; avoid relying on one alone.