1. Understanding Trends
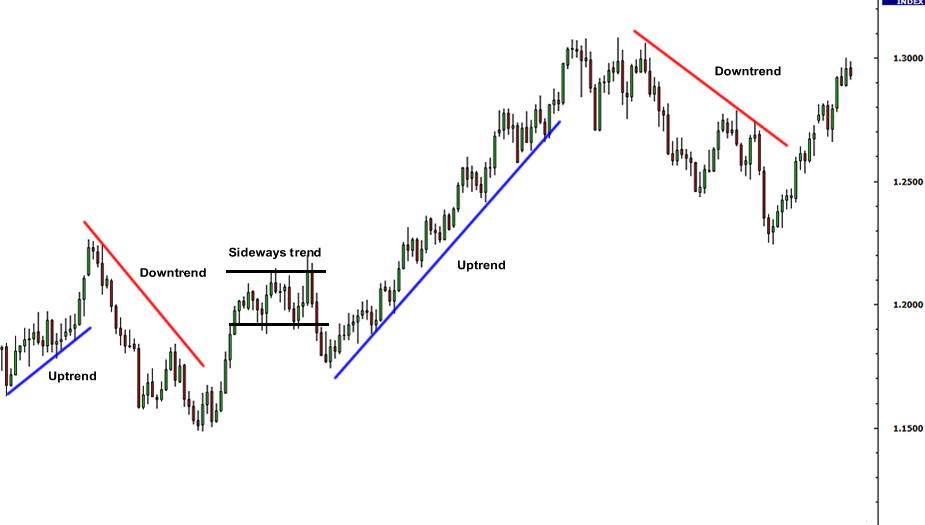
Trends represent the general direction in which currency prices are moving. There are three main types:
- Uptrend: Higher highs and higher lows; indicates bullish market sentiment.
- Downtrend: Lower highs and lower lows; indicates bearish market sentiment.
- Sideways/Range-bound: Prices move within horizontal support and resistance; market is indecisive.

2. Trendlines
Trendlines are straight lines along price lows in an uptrend or highs in a downtrend to visualize the trend direction:
- Uptrend line connects higher lows.
- Downtrend line connects lower highs.
- Breaks of trendlines can signal reversals or trend exhaustion.
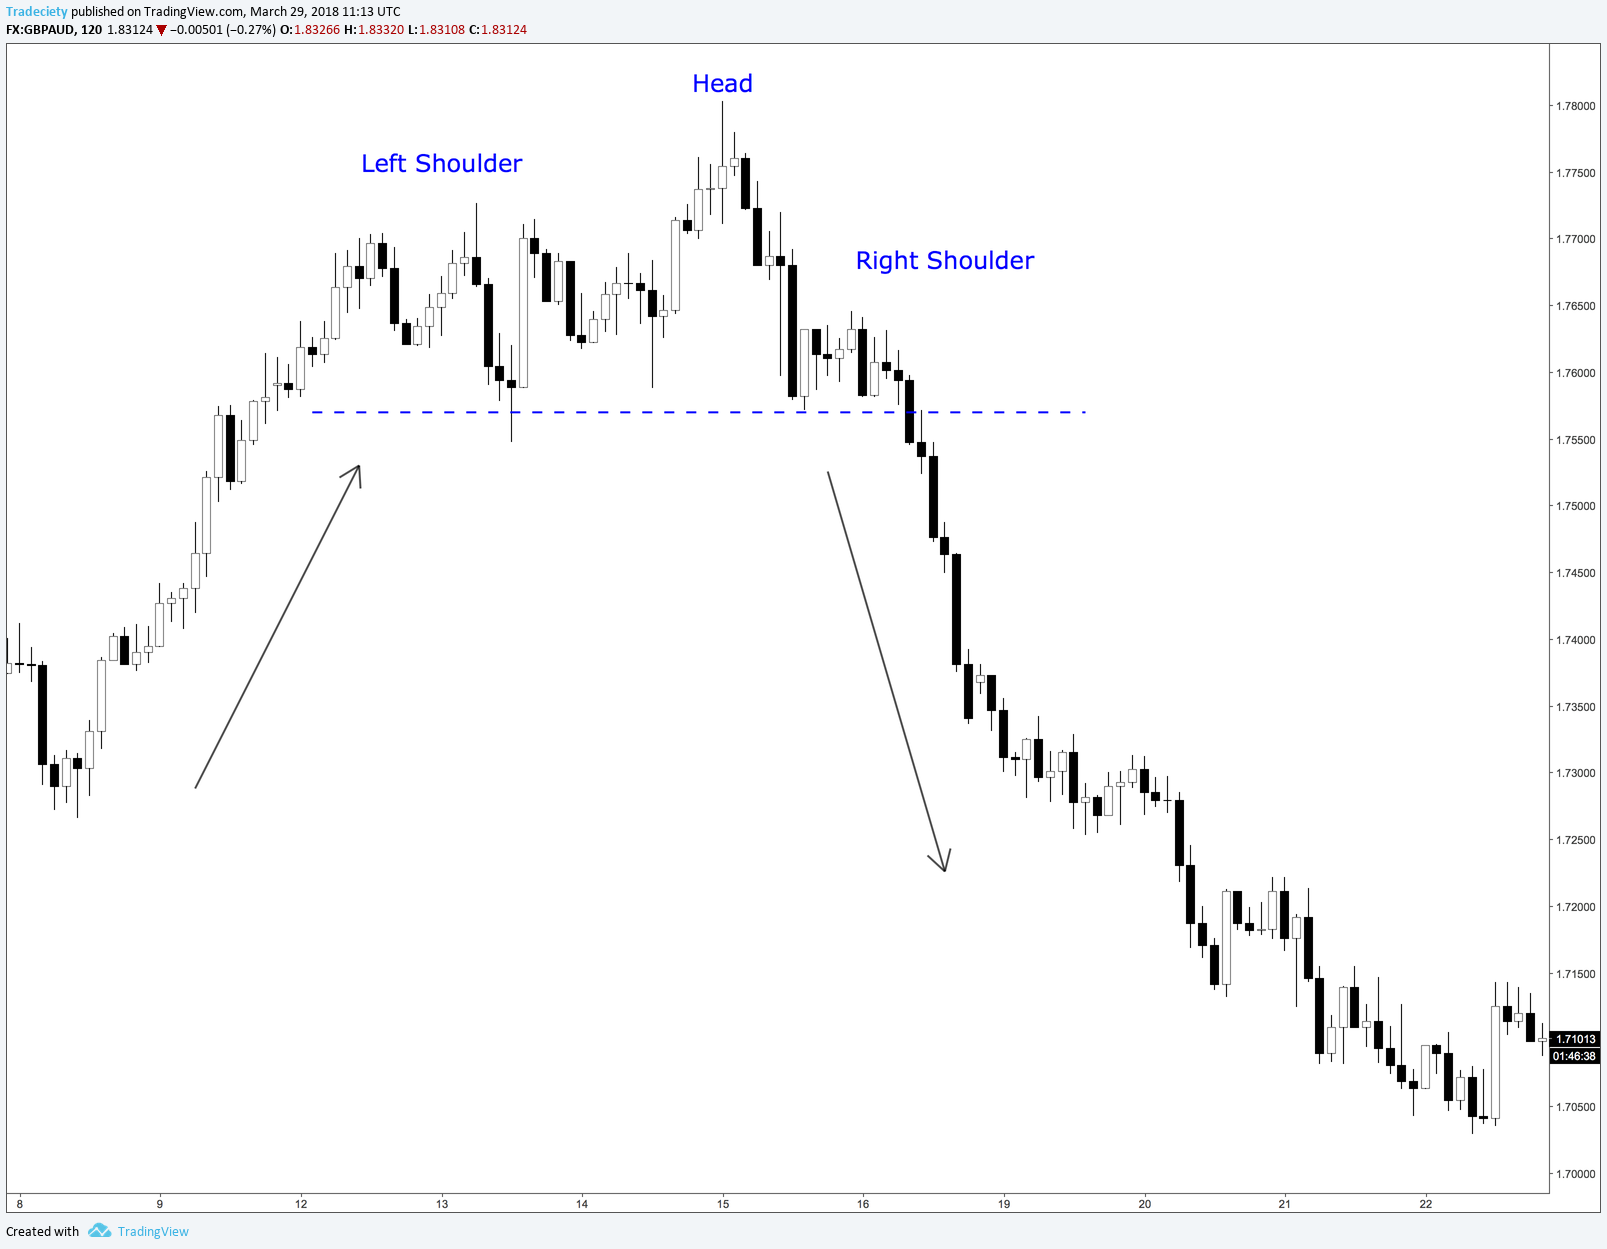
3. Common Chart Patterns
Chart patterns help traders anticipate future price moves:
- Head and Shoulders: Signals trend reversal; "Head" is highest peak, "Shoulders" lower peaks.
- Double Top/Bottom: Double Top indicates bearish reversal; Double Bottom indicates bullish reversal.
- Triangles: Symmetrical, ascending, and descending triangles indicate potential breakout points.
- Flags & Pennants: Short-term continuation patterns; usually occur after strong price moves.
4. Combining Trends & Patterns
Using trend analysis alongside chart patterns increases trade accuracy:
- Identify the main trend before trading patterns.
- Use patterns like triangles or flags in the trend direction.
- Confirm with volume and other indicators for higher probability trades.
Key Takeaways
- Trends give the market’s overall direction.
- Chart patterns provide visual cues for possible reversals or continuations.
- Combining both techniques improves trade timing and risk management.