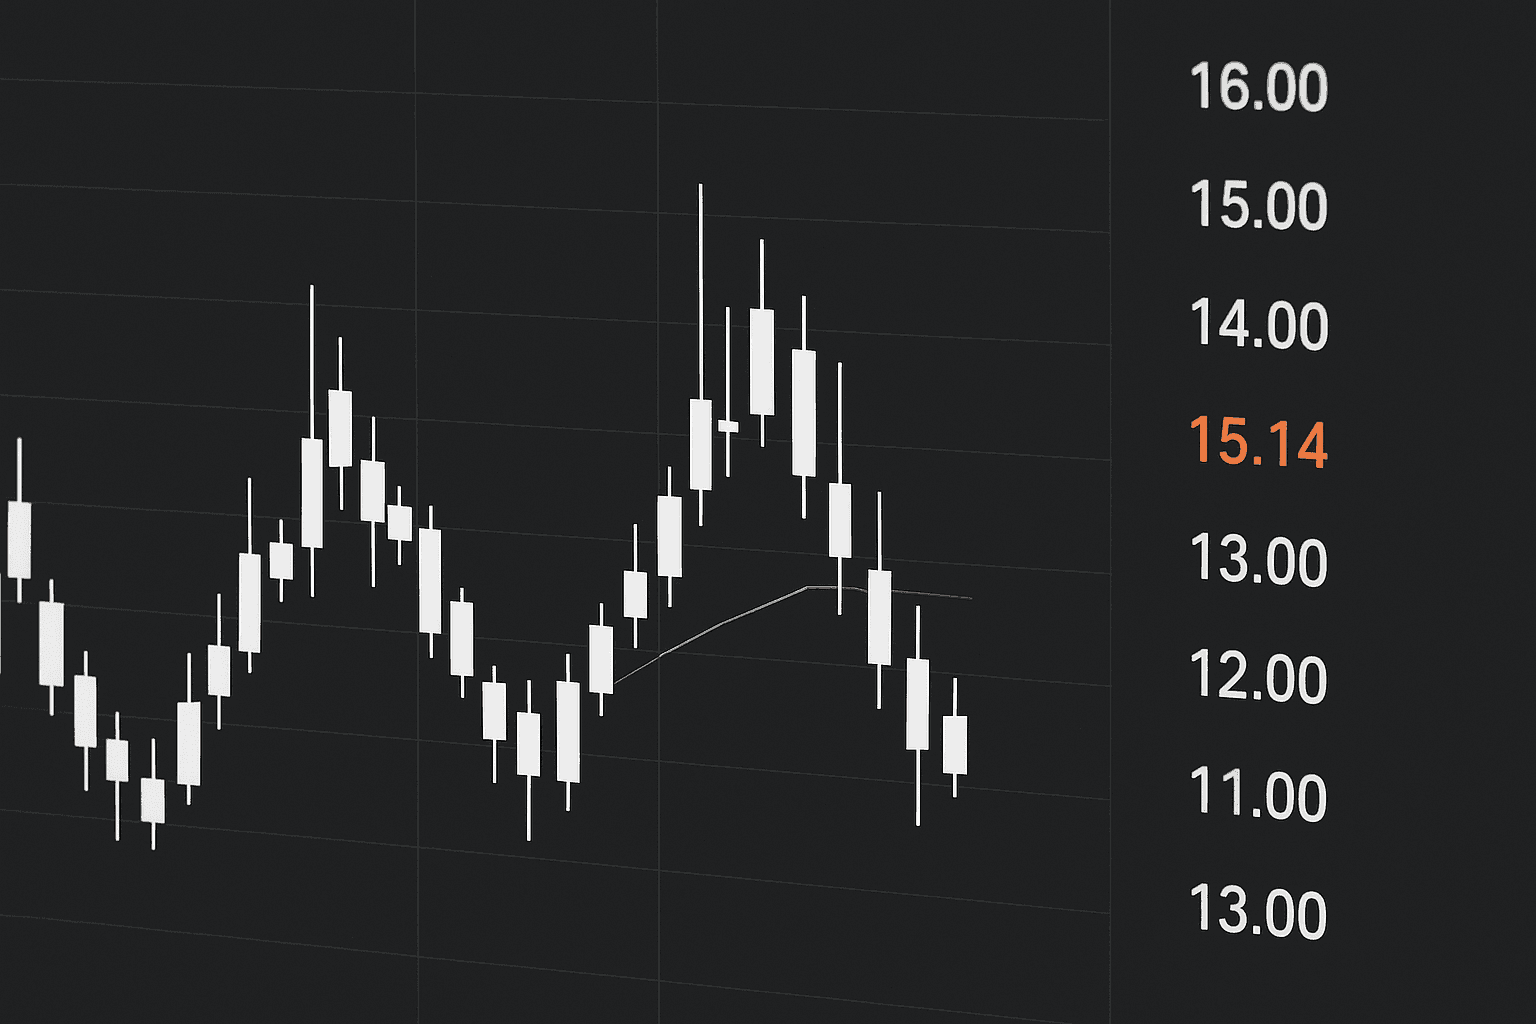
1. Understanding Forex Charts
Charts are visual representations of price movement over time. They allow traders to identify trends, reversals, and key levels.
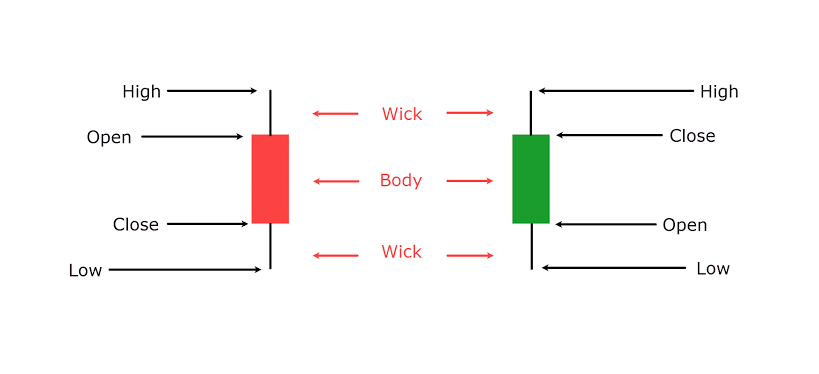
2. Candlestick Basics
Candlesticks display price action for a selected period, showing four key points: Open, High, Low, and Close (OHLC).
- Body: Difference between Open and Close.
- Wicks/Shadows: Highs and lows of the period.
- Bullish Candle: Close higher than Open; typically green or white.
- Bearish Candle: Close lower than Open; typically red or black.
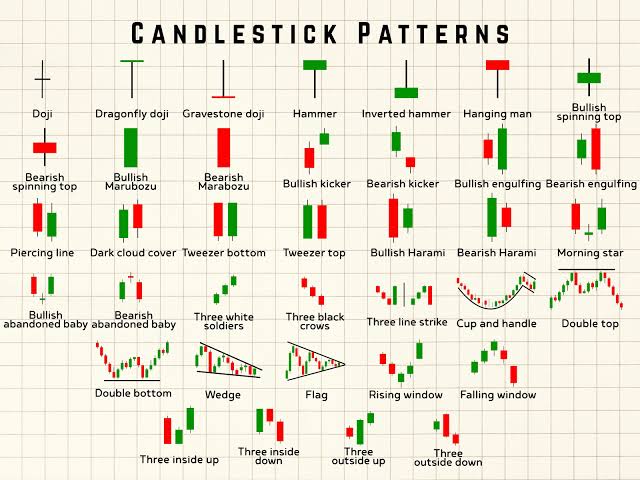
3. Common Candlestick Patterns
- Doji: indecision; Open and Close are nearly equal.
- Hammer: Bullish reversal after downtrend.
- Shooting Star: Bearish reversal after uptrend.
- Engulfing Pattern: Strong reversal signal when one candle fully engulfs the previous one.
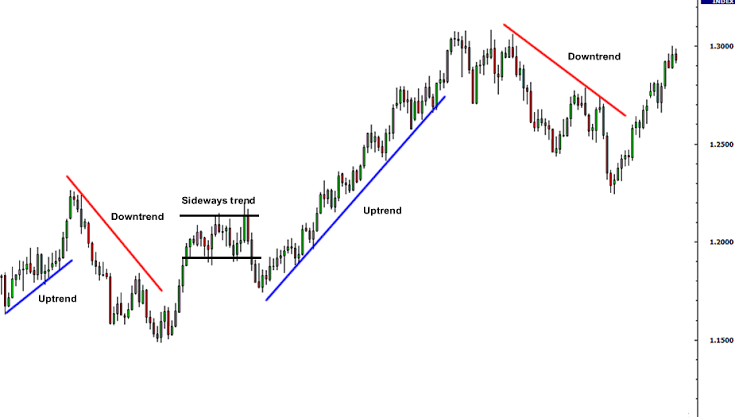
4. Reading Trends
Use candlesticks to identify trends:
- Uptrend: Series of higher highs and higher lows.
- Downtrend: Series of lower highs and lower lows.
- Sideways: Market consolidates within a range.
Key Takeaways
- Candlestick charts are essential to visualize Forex price action.
- Learn to identify patterns like Doji, Hammer, and Engulfing for trading decisions.
- Combine chart reading with trend analysis for entry and exit points.